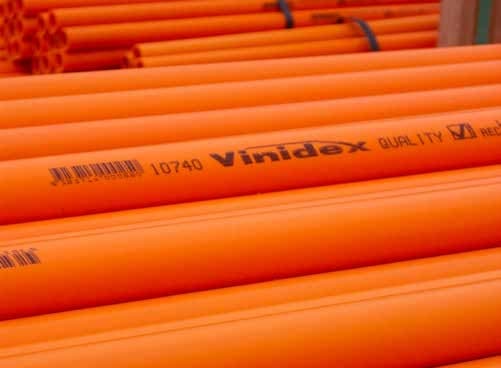
PVC pressure pipes PVC-U pressure pipe
vinidex Upfront Carbon Emissions
kg CO2e / kg (A1-A3)
kg CO2e / kg (A1-A3)
3.46
GWP - Fossil
3.46 kgCO2e
GWP - Biogenic
-0.01 kgCO2e
GWP - LULUC
< 0.01 kgCO2e
This data has been generated from publicly available EPD data.
Upfront Carbon Emissions is a summation of Fossil, Biogenic and Land Use emissions. It does not include biogenic sequestration. This is consistent with NABERS database.
Valid until: 15 September 2027
Upfront Carbon Emissions is a summation of Fossil, Biogenic and Land Use emissions. It does not include biogenic sequestration. This is consistent with NABERS database.
Valid until: 15 September 2027
Do you have any questions on this data?
Please contact us
Please contact us
Unplasticised polyvinyl chloride (PVC-U) pressure pipe for water supply, irrigation, pressure sewerage, slurry transport and industrial process pipelines. Manufactured to AS/NZS 1477.
Product specifications
Material
Plastic
Net weight
1.00 kg
Pricing
Availability
In Stock
Countries
AU
Downloads

Environmental Product Declaration
PDF • 1.4MB
About vinidex
Vinidex is a leader in Australian manufacturing and supply of advanced pipe systems and solutions, connecting Australian people with water and energy. We provide a broad range of pipeline systems and solutions for building (plumbing, electrical), infrastructure (water, wastewater, drainage, gas, electrical, communications), irrigation and rural, mining and industrial applications.
Website
https://www.vinidex.com.au Similar Products
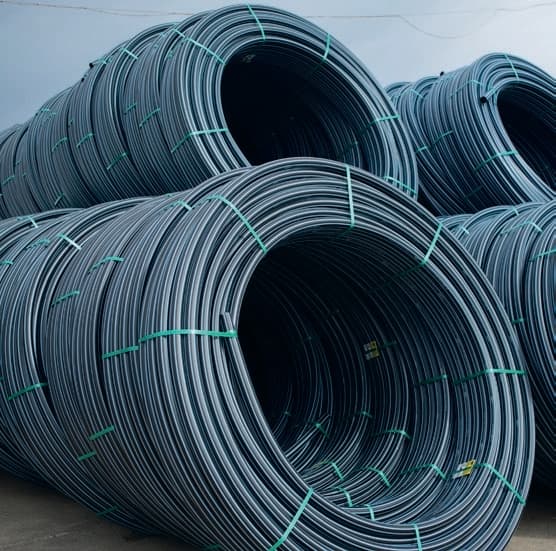
PE pipe, PE pipe
3.08
Upfront Carbon Emissions
kg CO2e / kg (A1-A3)
kg CO2e / kg (A1-A3)
N/A
benchmark
PVC pressure pipes PVC-M pressure pipe
3.55
Upfront Carbon Emissions
kg CO2e / kg (A1-A3)
kg CO2e / kg (A1-A3)
N/A
benchmark
PVC Non-pressure pipes and conduit
3.61
Upfront Carbon Emissions
kg CO2e / kg (A1-A3)
kg CO2e / kg (A1-A3)
N/A
benchmark
PVC pressure pipes PVC-O pressure pipe
3.63
Upfront Carbon Emissions
kg CO2e / kg (A1-A3)
kg CO2e / kg (A1-A3)
N/A
benchmark
Compare0
⇧+C